


From Drone to Digital Terrain Model: What Happens to Your Survey Data?


There is a tendency to think of a drone survey as the point at which the aircraft flies over a site and takes a lot of photographs. In reality, that is probably the least interesting part of the process.
The aircraft is simply the means of collecting the observations. The useful survey information comes later, when those observations are processed, positioned, checked and converted into a dataset that can actually be used by a surveyor, engineer or contractor.
A typical UAV survey might start with several hundred or several thousand photographs, or millions of LiDAR measurements. None of that is, by itself, a topographical survey. The challenge is turning those observations into a geometrically reliable representation of the site. That process starts before the first image is taken.
Planning the survey
The required end product should determine how the survey is flown.
There is little value in collecting extremely high-resolution imagery if the eventual requirement is a relatively small-scale site plan. Equally, flying a large site quickly with insufficient overlap or an inappropriate ground sampling distance can leave you with data that looks impressive but does not contain enough information to produce the required survey.
We normally start by considering what the client actually needs from the survey. That might be an orthomosaic, a classified LiDAR point cloud, a DTM, contours, an existing-ground surface for earthworks calculations, or a combination of these.
The terrain, vegetation, site size and required accuracy then influence the choice of sensor and acquisition method.
For photogrammetry, image overlap is critical because the software needs to identify common features between photographs. For LiDAR, the considerations are different. Point density, flight height, scan pattern and the ability of the sensor to obtain useful ground returns all become important.
Positioning is another fundamental part of the survey. RTK or PPK positioning can significantly reduce the reliance on traditional ground control, but it does not remove the requirement to understand and verify the survey's spatial accuracy. Where appropriate, we use independently positioned check points to assess the resulting dataset.
What actually comes back from the aircraft?
For a photogrammetric survey, the initial dataset consists primarily of photographs and the associated positioning and camera information.
The processing software first has to establish the relationship between those photographs. Features visible in multiple images are matched, allowing the software to determine the relative camera positions and reconstruct the geometry of the scene.
Once the imagery has been successfully aligned, a dense point cloud can be generated.
This is the point at which the survey starts to become a useful three-dimensional dataset.
A point cloud may contain millions of individual XYZ points. In a photogrammetric dataset, those points are derived from the image geometry. In a LiDAR survey, they originate from laser measurements recorded by the sensor.
The two technologies are therefore producing similar-looking outputs from fundamentally different measurements.
That distinction matters when deciding which technology to use.
From point cloud to terrain
A raw point cloud is not a Digital Terrain Model. It will normally contain points representing everything that the sensor has observed: ground, vegetation, buildings, vehicles, fencing, machinery and other objects.
Those observations have to be classified before a terrain model can be produced.
This is particularly important on sites with vegetation. A tree canopy can produce a very dense point cloud, but those points obviously do not represent the ground beneath it. With LiDAR, some laser pulses may penetrate gaps in the vegetation and produce ground returns. With photogrammetry, extracting the ground beneath dense vegetation is considerably more difficult because the camera can only reconstruct surfaces that are visible in the imagery.
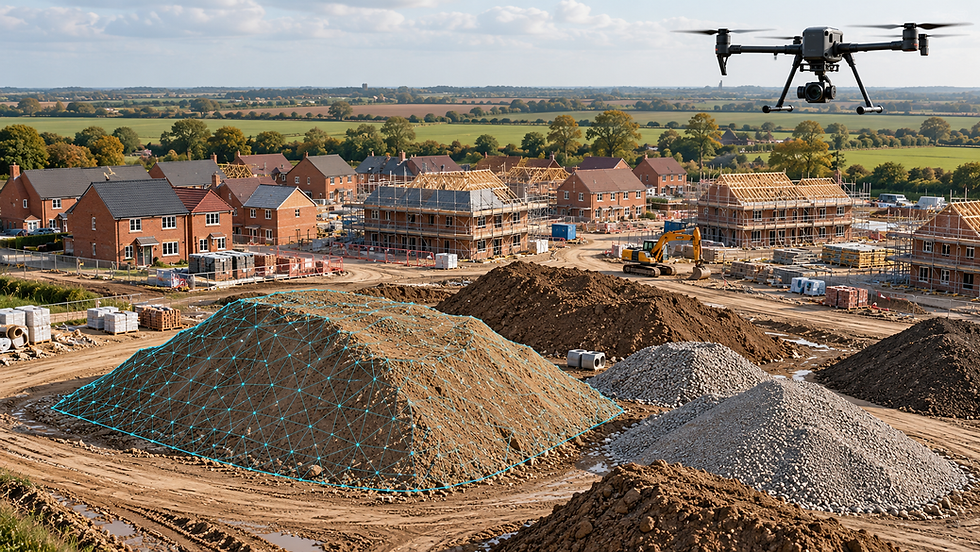
Once the point cloud has been classified, the ground points can be used to generate a terrain surface.This is the basis of the Digital Terrain Model.
A DSM is different because it represents the upper surface captured by the survey. Buildings, trees, stockpiles and other objects can therefore form part of the DSM, whereas a DTM is intended to represent the underlying terrain.
That distinction is important when using UAV data for engineering or earthworks.
Accuracy is not the same thing as resolution
One of the most common misunderstandings with drone surveying is the assumption that a very high-resolution image automatically means a highly accurate survey.
It doesn't.
A photograph can have millimetre-level pixel resolution and still be incorrectly positioned. Conversely, a dataset with a relatively coarse ground sampling distance can have very good absolute positioning if the survey has been properly designed and controlled.
There are several different aspects of accuracy to consider, including the relative geometry of the dataset, its absolute position and its vertical accuracy.
This is why simply quoting the camera resolution or the manufacturer's advertised RTK accuracy tells you very little about the accuracy of the final survey product.
The entire measurement chain has to be considered.
Turning the terrain model into a survey
Once the terrain surface has been generated and checked, it can be used to produce the deliverables required by the client.
Contours, for example, are derived from the underlying elevation model. They are not something the drone directly measures.
The same applies to many of the products commonly described as “drone survey data”. A cut-and-fill calculation is derived from surfaces. A volume is calculated from a defined boundary and an elevation model. A set of contours is generated from terrain elevations.
The quality of those outputs therefore depends on the quality of the source survey and the processing decisions made along the way.
For construction and earthworks projects, this can make a significant difference. A small systematic error in the vertical component of a survey can become significant when it is used across a large area to calculate volumes.
Quality control
Processing is not simply a case of pressing “generate” and accepting whatever the software produces.
The resulting point cloud and surface need to be inspected for gaps, erroneous points, misclassification and other problems. Where ground control or independent check points have been used, these provide a means of assessing the accuracy of the finished dataset.
The coordinate reference system and vertical datum also need to be correctly defined.
For UK surveying projects, this may involve working with British National Grid, OSGB36 and an appropriate vertical reference system. Getting the coordinate transformation or height datum wrong can produce a dataset that looks perfectly convincing in CAD or GIS while being incorrectly positioned.
That is one of the less obvious risks of using aerial survey data.
The final product
The final deliverable might be a georeferenced orthomosaic, a classified LAS or LAZ point cloud, a DTM or DSM, contours, CAD linework, an existing-ground surface, a 3D model or an earthworks calculation.
The choice depends entirely on what the survey is intended to achieve.
At UAV Surveys, we work across the whole process rather than treating the aircraft operation as the finished product. Our experience covers UAV data acquisition, RTK/GNSS positioning, LiDAR and photogrammetry, point-cloud processing and the production of survey-ready geospatial data.
The objective is straightforward: collect the right data, understand its limitations, process it correctly and provide the client with something they can actually use.
A drone is very good at collecting information quickly.
Turning that information into dependable survey data is where the real work begins.


Comments